The 10 Most Important Charts in Real Estate
The 10 Most Important Charts in Real Estate 📊
1) Industrial Vacancy to Peak Just Above 7%
Even after white-hot growth industrial rents are expected to stay steady with vacancies peaking within the year.
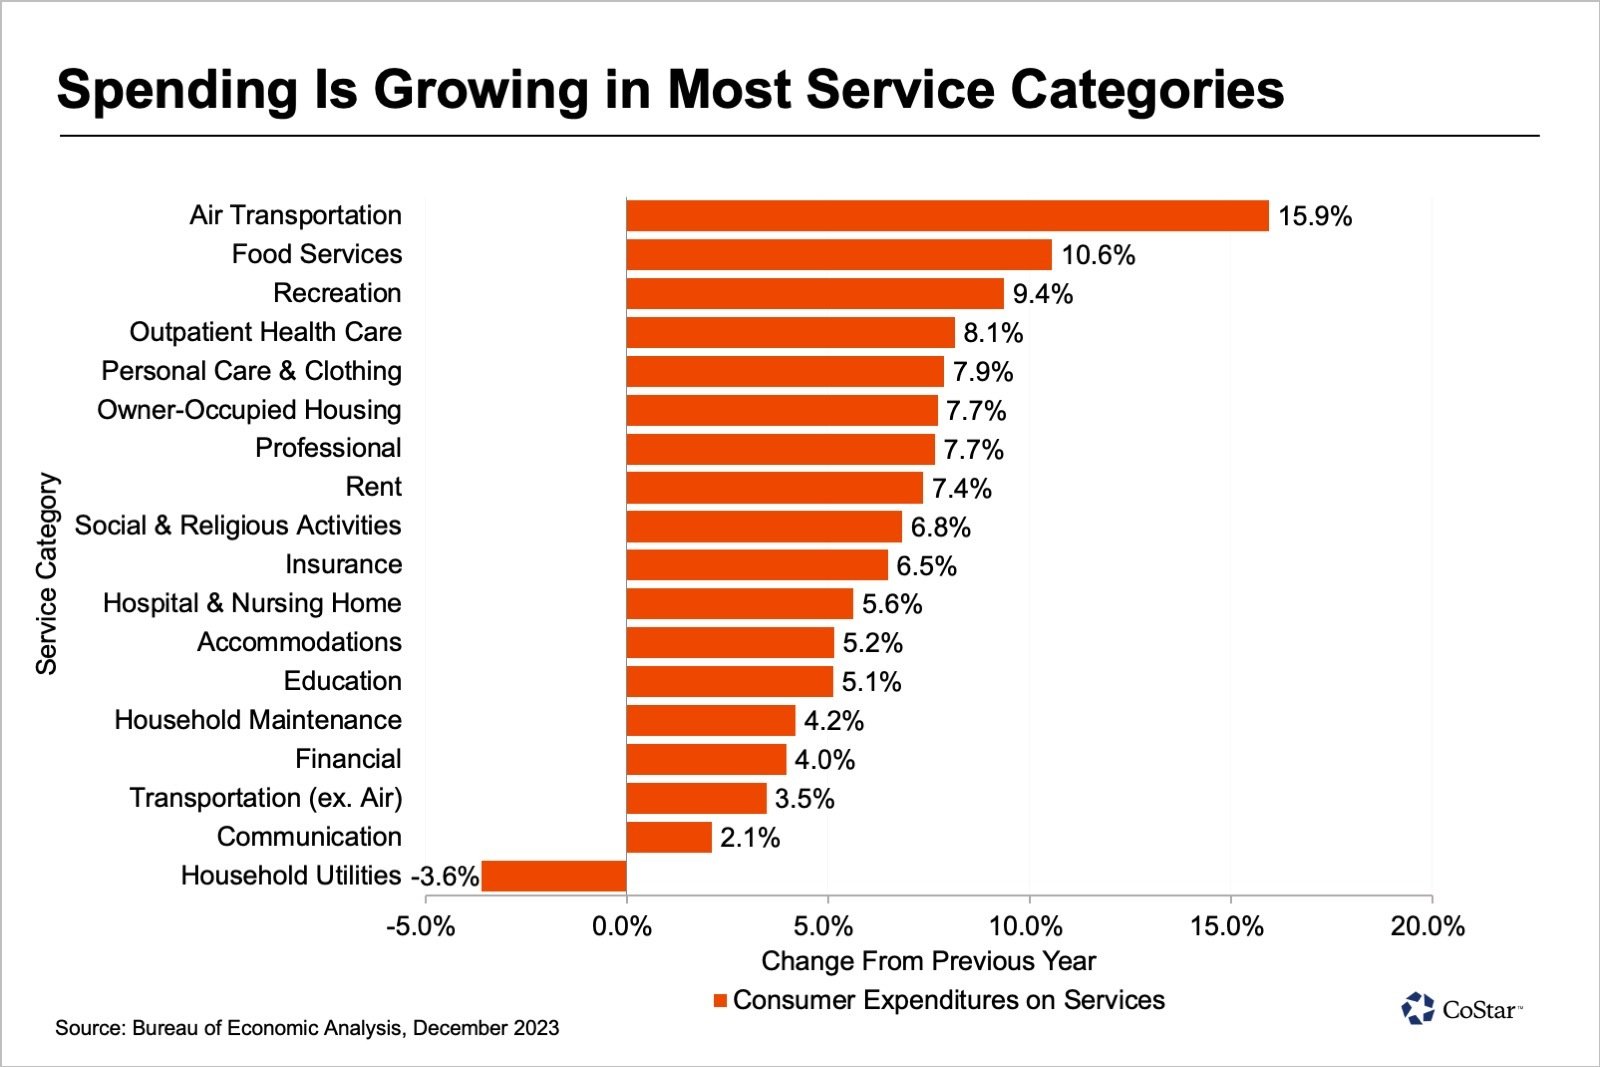
2) Consumer Spending Stays Strong for Services, Travel & Recreation
You can't keep the U.S. consumer down. Spending patterns look constructive for hospitality, leisure and experiential real estate.
3) Still Not Building Retail
The death of brick-and-mortar has been greatly exaggerated. As any retail broker will tell you: "You can't get your haircut online!" Yet, retail construction starts are still well below the historical average, a positive trend for existing assets that are experiencing record low vacancy and robust rent growth.
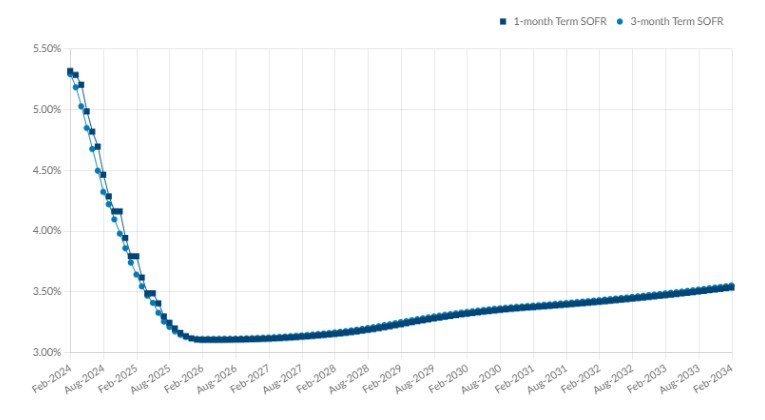
4) The Term SOFR Curve
Real estate runs on debt. As political strategist James Carville quipped "I used to think that if there was reincarnation, I wanted to come back as the President or the Pope or as a .400 baseball hitter. But now I would like to come back as the bond market. You can intimidate everybody." The Secured Overnight Funding Rate, the benchmark rate for commercial mortgages, is a key determinant of real estate values.
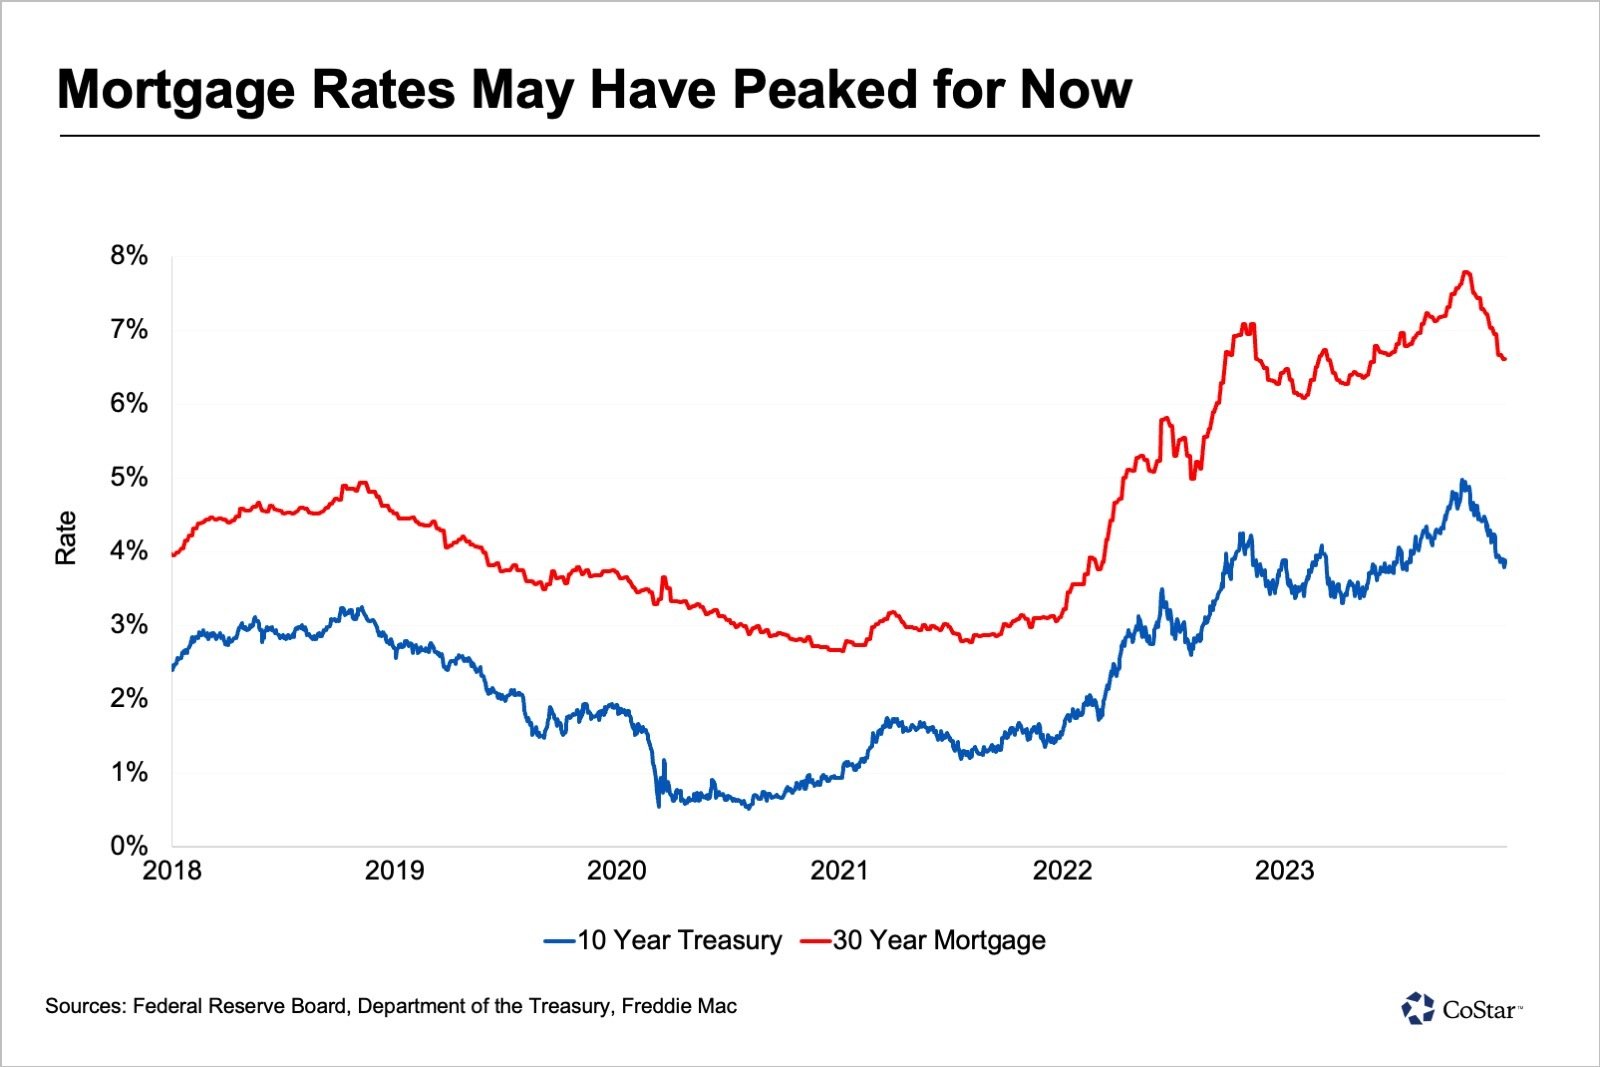
5) Peak Residential Mortgage Rates?
Mortgage rates appear to have peaked, but the downward move is doing little thus far for home affordability as lower rates are continuing to drive higher home prices.
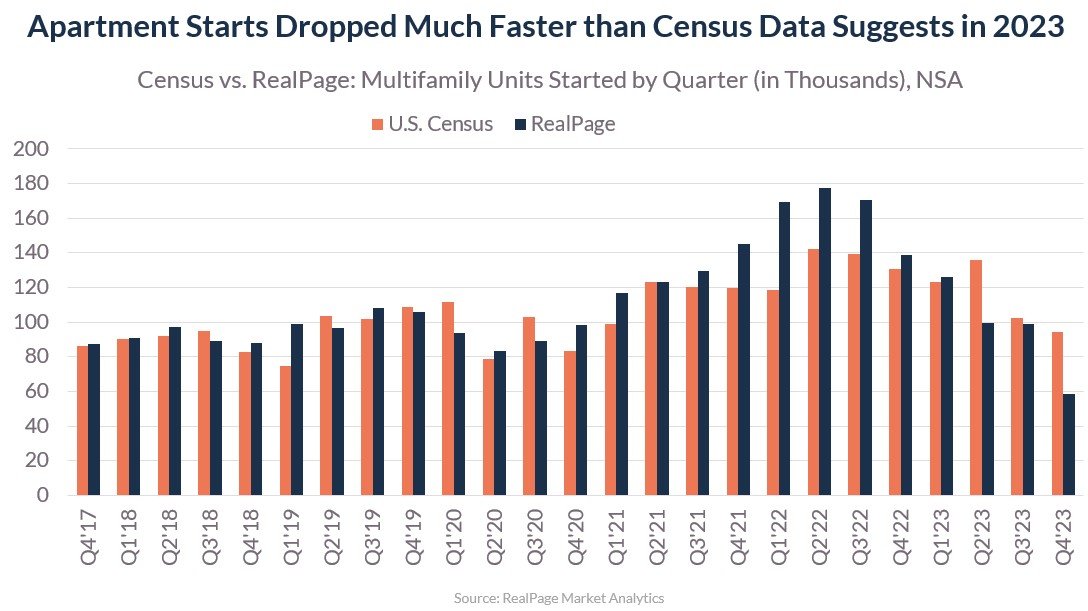
6) Multifamily Supply Crunch Coming
While 2021 & 2022 saw a massive increase in the number of multifamily units under-construction, rapidly rising rates and input costs put an even bigger damper on multifamily housings starts in 2023 than initially thought.
Source: Avison Young
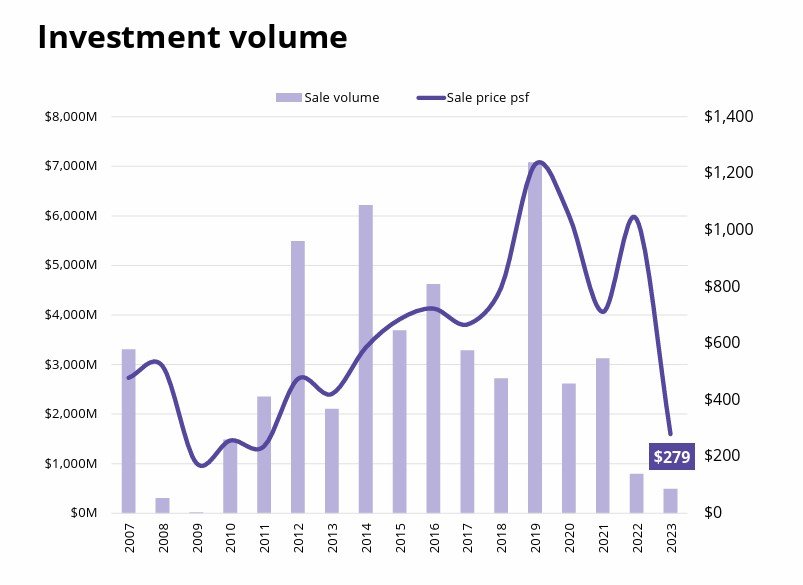
7) San Francisco Office Finds New Lows
It's always darkest before the dawn. At least that's what San Francisco office investors are hoping. This new nadir in sale price per square foot represents a 76% loss in value from peak valuations.
8) CMBS Delinquency Trends
For office and multifamily there may still be some pain yet to come as credit rating agency Fitch anticipates rising delinquency rates over the next two years.
9) Bank Survey Suggests Some Easing Credit Conditions
Compared to the almost total freeze of 2023, banks appear to be tiptoeing back to the commercial real estate market. The trajectory of the SOFR curve (see chart #4) could accelerate or decelerate these trends.
10) Public REIT vs Private Real Estate Correlations
While we tend to focus on valuations, the difference in correlation with the broad equity market has also never been higher between public and private real estate.


